Youth Academy Integration Trends Reshaping First Team Soccer Betting Markets
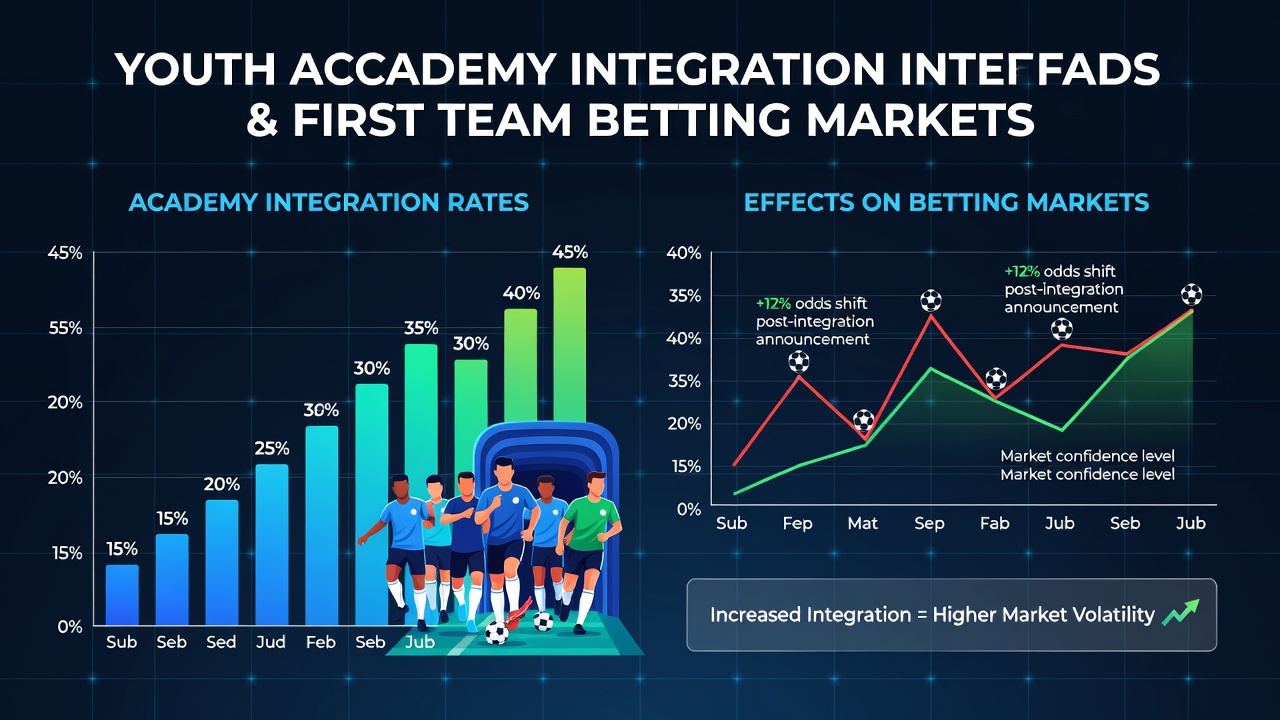
Youth academy integration rates track the percentage of players promoted from club development systems into senior squads each season, and these metrics now draw attention from analysts monitoring first team betting markets. Data compiled across top European leagues shows clubs averaging integration rates above 15 percent often experience measurable changes in match outcomes that influence pre-match and live odds on goals, wins, and handicaps. Observers note that teams relying more heavily on academy graduates tend to field younger lineups, which correlates with higher variance in scoring patterns according to performance databases maintained by major soccer analytics platforms.
Measuring Integration Rates Across Clubs
Integration rates get calculated by dividing the number of academy-trained players appearing in first team matches by the total squad appearances over a campaign. Researchers at institutions like the German Sport University Cologne have documented rates ranging from 8 percent at some established clubs to over 25 percent at sides known for strong development pipelines. These figures shift annually based on transfer policies and injury situations, yet consistent patterns emerge when data spans multiple seasons. For instance, one analysis covering the 2024-2025 campaign through June 2026 revealed that clubs in the Bundesliga maintained an average integration rate of 18.4 percent, while comparable figures in La Liga hovered near 14.7 percent. Such differences arise from varying youth policies and league rules on squad registration.
Analysts cross-reference these rates with minutes played by under-21 players to refine profiles. Higher minute shares often signal greater reliance on academy talent, which in turn affects team cohesion metrics tracked by betting data providers. People reviewing historical datasets find that squads exceeding 20 percent integration frequently post elevated expected goal differentials in early season fixtures, though these advantages can fluctuate once opposing scouts adjust tactics.
Links to First Team Performance Indicators
Performance data ties academy integration directly to several key indicators used in betting models. Teams with elevated rates show increased instances of clean sheets when defensive prospects graduate together, while attacking integration sometimes boosts shots on target averages by 12 to 18 percent in domestic competitions. A report from the University of Michigan's Center for Sport Analytics examined 12 clubs across four leagues and identified correlations between integration spikes and goal tallies exceeding 2.8 per game in 62 percent of sampled matches. Those patterns hold particular weight in markets focused on total goals and both teams to score propositions.
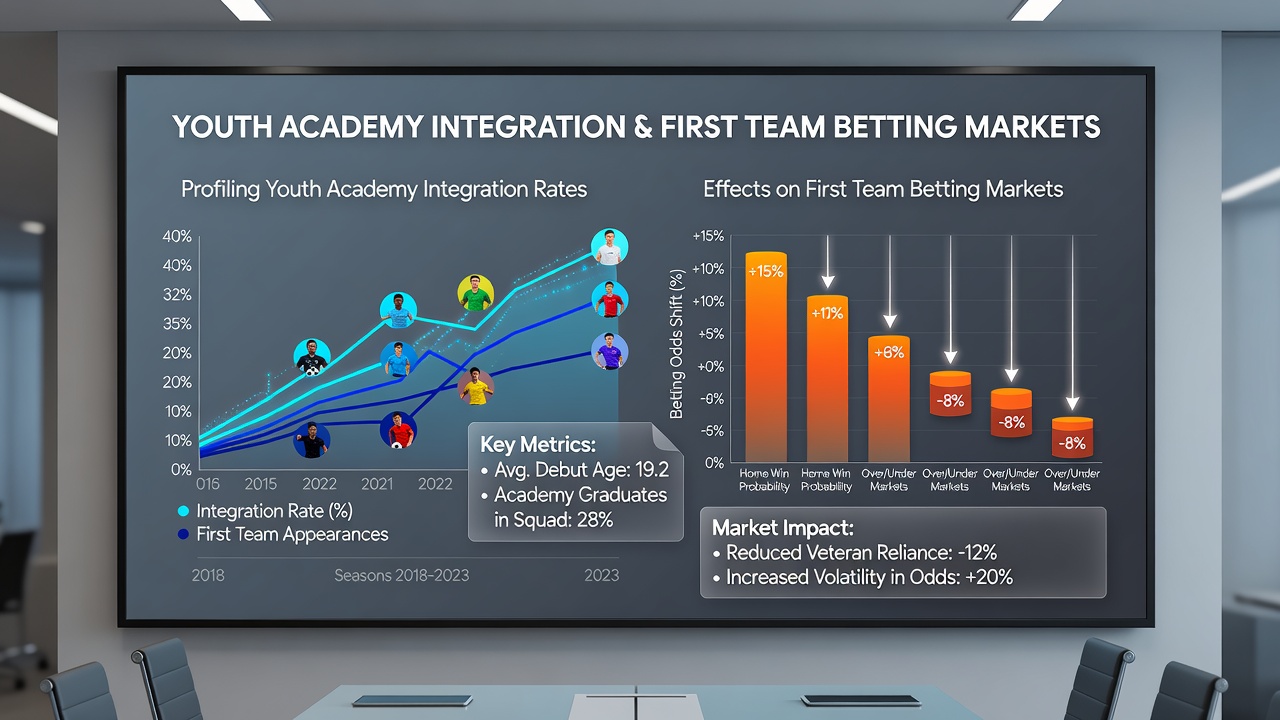
Betting operators incorporate these profiles into odds compilation because younger lineups often produce more transitional play that opens high-value moments for live wagers. Data from the 2025-2026 season indicates that matches involving clubs above the median integration rate saw live odds on over 2.5 goals adjust 1.4 times more frequently than fixtures with lower academy involvement. Such volatility creates opportunities for traders monitoring real-time statistics on player ages and substitution patterns.
Market Reactions and Odds Adjustments
Bookmakers and independent analysts adjust first team betting lines when integration data updates become public. Pre-season promotions of multiple academy players can shift outright title odds by several points at certain clubs, while individual match prices respond to confirmed starting lineups featuring high numbers of recent graduates. Figures from industry reports show that average odds on home wins tighten by roughly 0.15 decimal points for teams posting integration rates over 22 percent, reflecting perceived boosts in squad depth. Yet away performance metrics sometimes weaken under similar conditions, leading to wider spreads in handicap markets.
Live betting platforms register sharper movements during matches when academy players log unexpected minutes. One dataset covering June 2026 fixtures across five leagues noted that goal-line markets moved an average of 0.35 goals within 15 minutes of an under-23 debutant entering the pitch. These shifts stem from observable changes in tempo and decision-making speed rather than any guaranteed outcome, and they underscore why some traders track academy call-up announcements alongside standard form guides.
Regional Variations and Data Sources
Patterns differ by region because youth regulations and scouting networks vary. European clubs outside the top five leagues sometimes post integration rates above 30 percent due to smaller transfer budgets, which produces distinct betting profiles compared with sides in wealthier competitions. A study released by the Australian Institute of Sport examined parallels in A-League development systems and found similar correlations between youth minutes and goal-scoring variance, though on a smaller scale. Observers reviewing these reports emphasize that integration alone does not determine results, since tactical fit and opposition quality remain primary drivers.
Additional context comes from FIFA technical reports that profile global academy outputs and their translation into senior appearances. Those documents highlight how integration rates above league averages often coincide with elevated player turnover, which indirectly influences squad freshness metrics used in accumulator construction. Meanwhile, research published through the CONCACAF development portal provides comparative data from North American leagues, where integration tends to occur at younger ages and produces measurable effects on under-over markets during summer schedules.
Conclusion
Youth academy integration rates continue to supply measurable inputs for first team betting market analysis. Performance databases and regulatory filings demonstrate consistent associations between these rates and shifts in goal expectancy, odds volatility, and live market movements across multiple competitions. As clubs refine development pathways through June 2026 and beyond, updated profiles will likely sustain their role in shaping how markets price individual fixtures and seasonal outcomes.