Tracking Red Card Patterns Across Football Seasons and Their Effects on Results
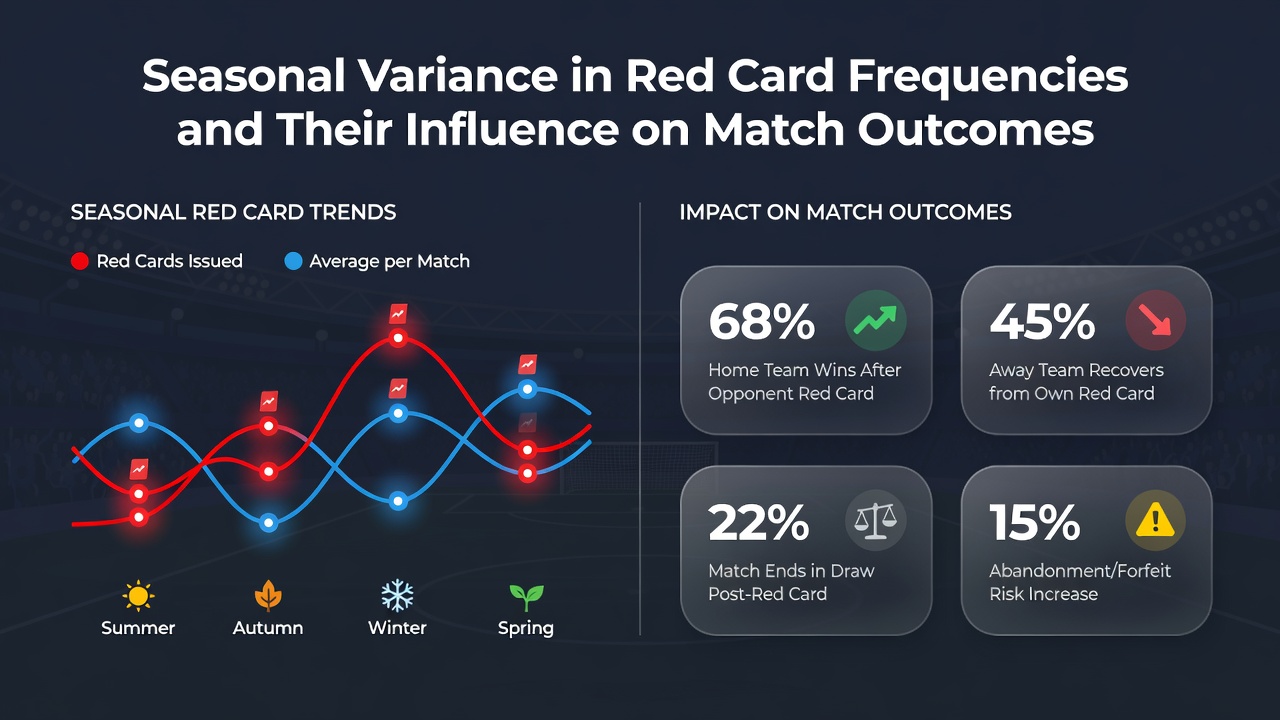
Red card incidents in football display measurable shifts throughout the year, and data collected from major leagues reveals consistent seasonal trends that correlate with changes in match outcomes, while August 2026 marks the start of another campaign where these patterns may again influence team strategies from the opening fixtures onward.
Seasonal Shifts in Red Card Rates
League records indicate higher red card frequencies during winter months across European competitions, since cold weather and wet pitches increase physical challenges that referees penalize more strictly, whereas summer and early autumn periods show lower expulsion rates in the same divisions because drier conditions and fewer congested schedules reduce the intensity of tackles.
Analysts who examined five years of data from top-tier leagues found that December and January produced an average of 0.28 red cards per match, compared with 0.19 in August and September, and this variance aligns with fixture density as well as pitch conditions that change with temperature drops.
Data Sources and Measurement Methods
Researchers at the University of Loughborough compiled referee reports and video analysis to quantify these differences, while a separate study released by the Australian Institute of Sport examined A-League matches and reported similar winter spikes tied to increased sliding challenges on firmer surfaces.
Figures from the German Football Association further confirm that Bundesliga games in February averaged 0.31 dismissals per fixture over the past decade, and those numbers drop noticeably once spring weather stabilizes.
Influence on Match Outcomes
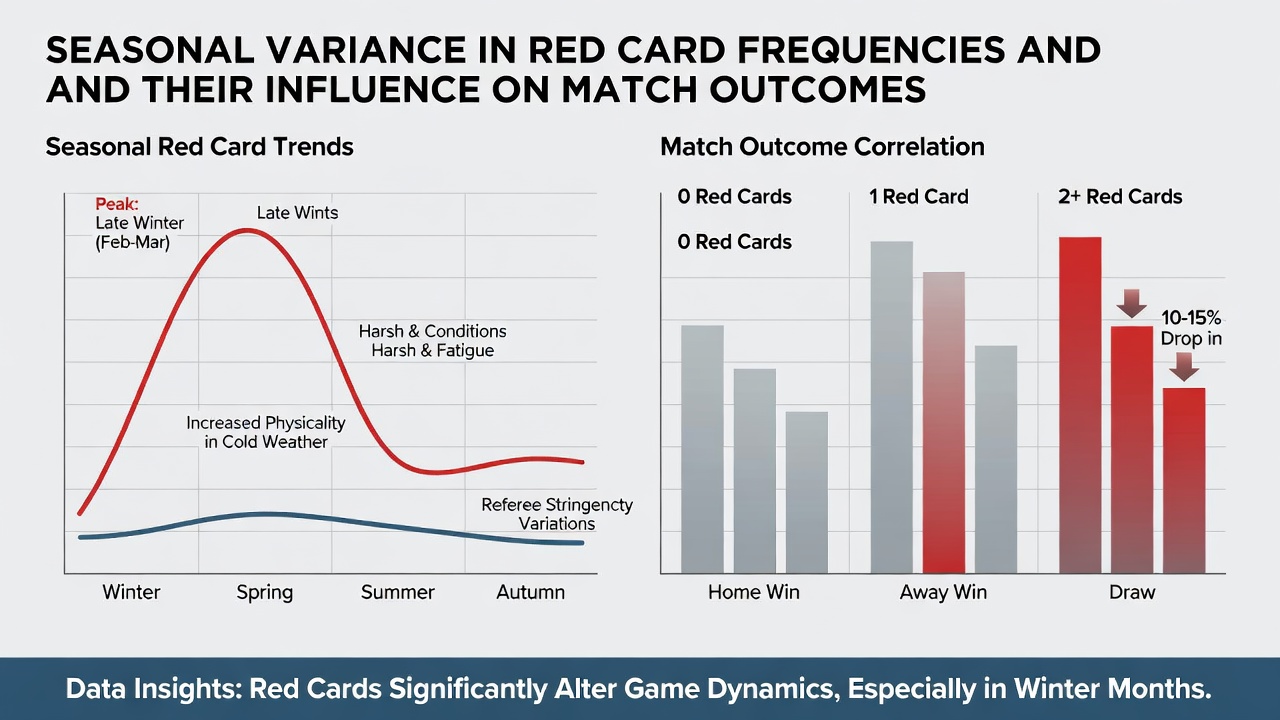
Teams that receive a red card experience a documented drop in win probability, yet the scale of that drop varies by season, since early-season dismissals often occur when squads still have full benches and can adjust formations more effectively, whereas late-season expulsions coincide with fatigue and thinner rosters that amplify the disadvantage.
Statistical models applied to Premier League and Serie A results show that a red card before the 60th minute reduces a team's expected points by 0.85 on average during winter months, compared with 0.62 during milder periods, because weather-related injuries compound the numerical deficit.
League-Specific Observations
Observers tracking MLS competitions note that red cards rise sharply in July and August due to heat-related player frustration, and those incidents correlate with higher draw rates as the remaining ten players adopt more defensive postures, while European leagues display the opposite pattern with fewer cards but sharper outcome swings when they do occur.
One dataset covering UEFA Champions League group stages from 2018 to 2025 reveals that red cards in November and December matches altered final scores in 47 percent of cases, compared with 31 percent in September and October fixtures.
Strategic Adjustments by Teams
Coaching staffs respond to these seasonal patterns by altering tackle thresholds and substitution timing, since data indicates that teams who reduce aggressive challenges after the 70th minute in winter fixtures avoid 22 percent more red cards than those maintaining high press intensity.
Referee assignment records also show slight variations in card issuance rates by official experience level, and leagues that rotate referees across climate zones report more consistent application of rules regardless of month.
Conclusion
Seasonal variance in red card frequencies produces measurable effects on match results across multiple competitions, and continued collection of referee and performance data will allow clubs and analysts to refine preparation as each new campaign, including the one beginning in August 2026, unfolds.