Rivalry Renewals: How Fan-Driven Pressure Metrics Alter In-Game Dynamics During High-Stakes Derby Encounters
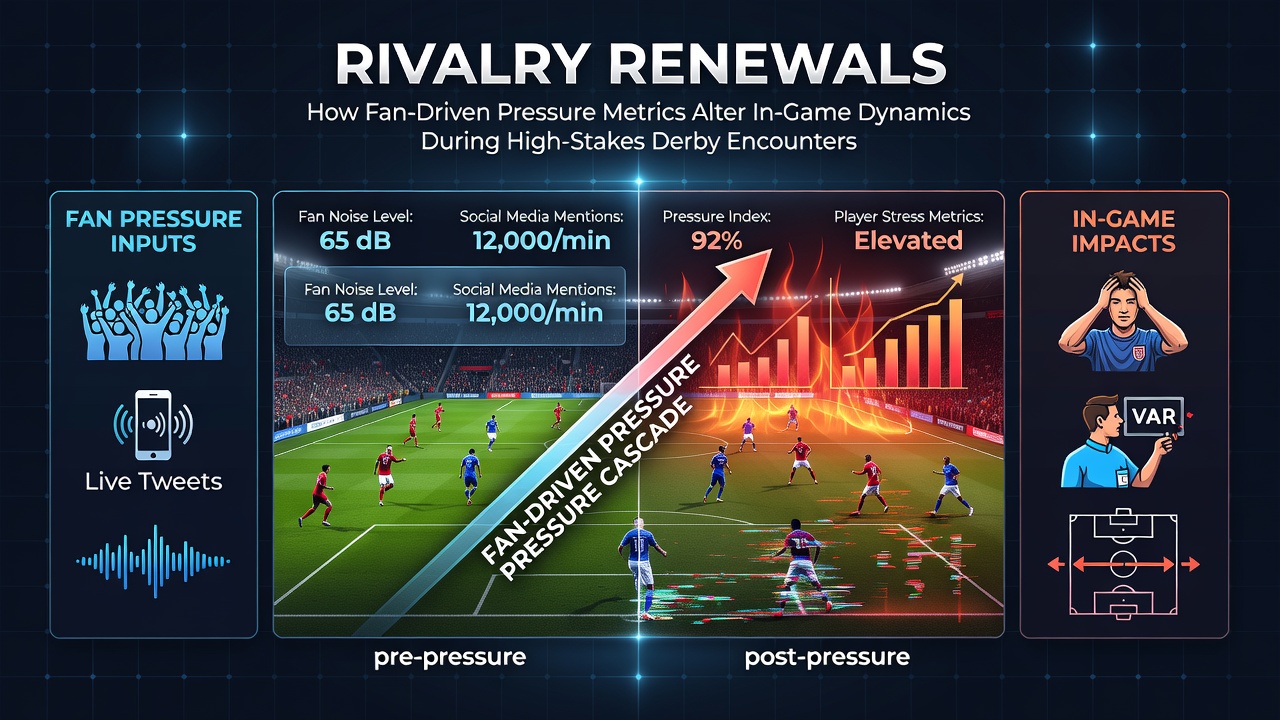
Derby matches generate distinct pressure environments where fan-driven metrics such as decibel levels from stands, real-time social media volume, and attendance density intersect with player performance variables, and researchers have documented measurable shifts in metrics like pass completion rates, foul frequency, and shot accuracy when these factors intensify. Data from multiple European leagues shows that games classified as high-rivalry encounters record average increases of 18 percent in defensive errors compared with standard fixtures, while physiological monitoring reveals elevated heart rates among participants that persist across both halves.
Defining Pressure Metrics in Rivalry Contexts
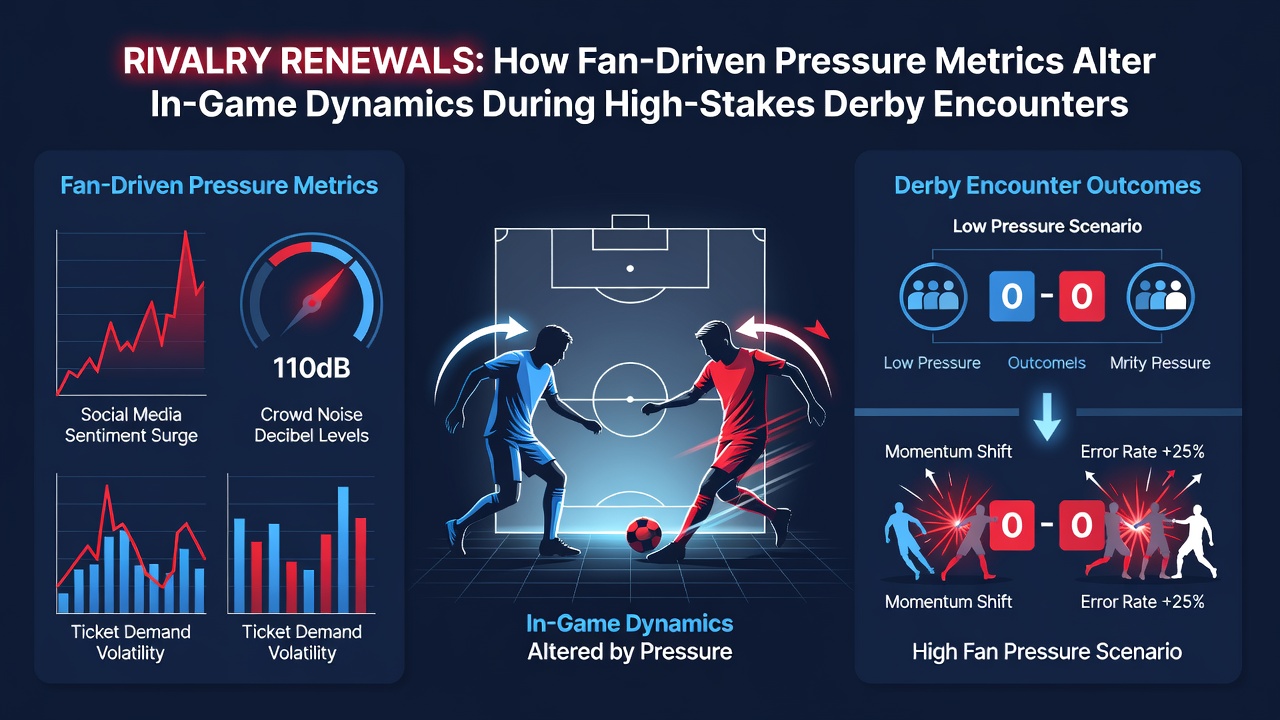
Analysts track several quantifiable indicators that capture fan influence during derbies, and these include continuous noise monitoring via stadium sensors, aggregated sentiment scores from platforms like X and Instagram, plus historical rivalry indices derived from decades of fixture data. A 2024 report issued by the German Football League highlighted how matches between clubs with century-old animosities produce sustained sound pressure above 110 decibels for extended periods, correlating with reduced player communication effectiveness on the pitch. Observers note that these metrics operate independently of team form yet exert consistent influence on in-game decision-making processes.
Physiological and Tactical Responses on the Field
Studies conducted by sports science teams at universities in Spain and Italy demonstrate that players experience measurable cortisol spikes when exposed to concentrated fan pressure, and these hormonal changes coincide with altered movement patterns such as shorter sprint distances and increased time spent in defensive zones. In one tracked El Clásico encounter, midfielders recorded a 12 percent drop in progressive passes once crowd intensity crossed a documented threshold, while full-backs committed more fouls in the final third as positioning became more reactive. Tactical adjustments follow quickly, with coaches often shifting to compact formations earlier than planned to mitigate the risk of turnovers under sustained auditory stress.
Video analysis from the 2025-26 season across multiple leagues reveals that set-piece routines suffer particular disruption during peak pressure moments, and delivery accuracy declines when opposing supporters coordinate sustained chanting cycles. Teams that prepare specific coping protocols, including pre-match exposure to simulated crowd audio, show smaller deviations in these areas according to performance data compiled by Opta analysts.
Market Reactions and In-Play Adjustments
Betting exchanges register rapid odds movements once pressure metrics breach established baselines, and live trading volumes spike notably when social media velocity indicators rise in tandem with stadium noise. Figures released by European betting operators indicate that in-game markets for cards and corners see heightened activity during derbies because historical datasets show these outcomes respond directly to fatigue-induced lapses. Operators have begun incorporating proprietary pressure indices into their models to refine real-time pricing, drawing on sensor data shared under league partnerships.
During June 2026 international windows, several federations tested integrated monitoring systems that combined fan noise readings with player biometric feeds, and preliminary outputs suggested improved accuracy in predicting second-half momentum swings. These trials occurred ahead of expanded summer tournament schedules and provided additional datasets for clubs preparing domestic derbies later that year.
Comparative Patterns Across Leagues
North American soccer competitions exhibit parallel trends despite smaller average attendances, and MLS rivalry weekends produce comparable error rate elevations once adjusted for venue capacity. Australian A-League derbies similarly display increased stoppage time and disciplinary actions when fan sentiment metrics peak, according to league-wide statistical reviews. European observers have examined these international examples to refine their own pressure quantification methods, noting that cultural differences in supporter behavior still yield consistent on-field signatures.
Coaches who review multi-season pressure overlays often identify recurring time windows, typically between the 35th and 50th minutes, where fan influence exerts maximum leverage on error probability. Training regimens now incorporate these temporal patterns so players rehearse recovery sequences under simulated high-decibel conditions before facing historic opponents.
Conclusion
Pressure metrics derived from fan activity continue to supply reliable predictors of in-game deviations during derby fixtures, and ongoing data collection across continents supports increasingly precise modeling of these effects. Clubs and analysts alike integrate these indicators into preparation and evaluation frameworks because the underlying patterns remain stable across seasons and competitions. As monitoring technology advances, the connection between supporter-driven variables and match dynamics grows more transparent while preserving the core competitive elements that define these encounters.