Recovery Windows in Packed Soccer Calendars: Building Accumulators Around Player Fatigue Patterns
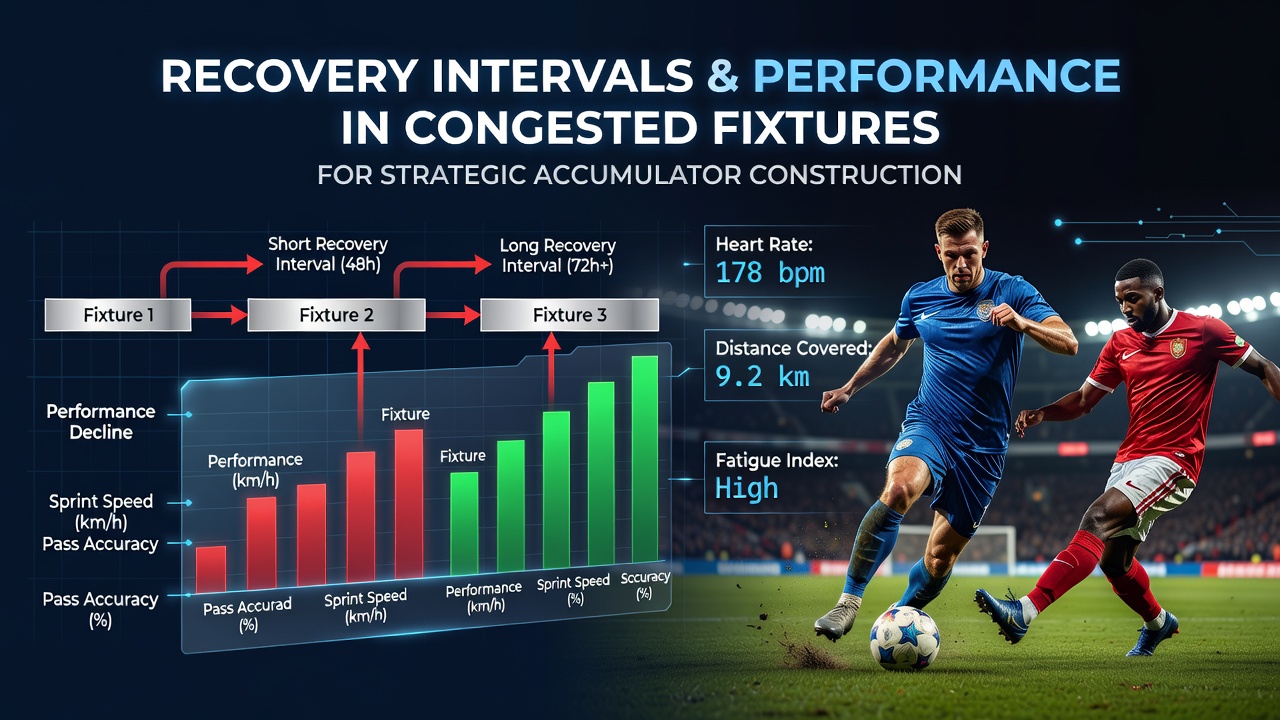
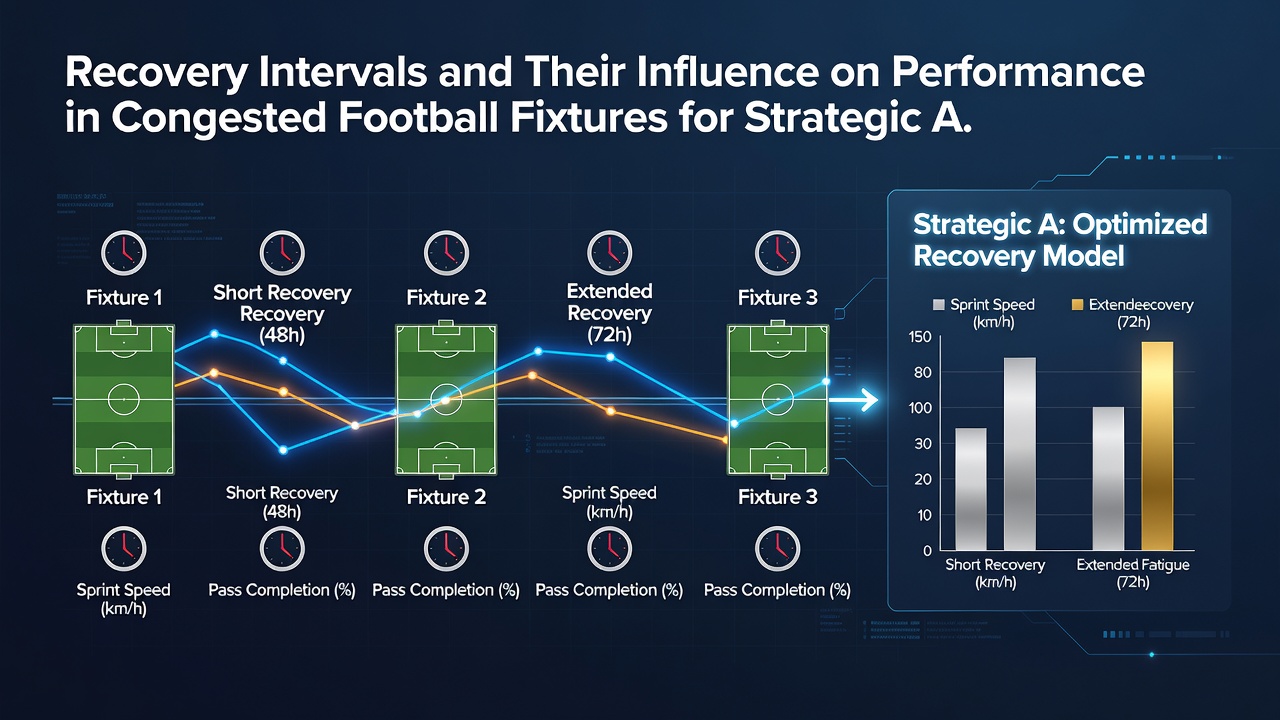
Recovery intervals play a direct role in how squads handle back-to-back matches, and data from multiple European leagues shows measurable drops in sprint distance and pass accuracy when rest periods shrink below 72 hours. Observers note that these patterns appear consistently across domestic cups, European ties, and international windows, creating repeatable edges for those constructing accumulators around team output.
Studies from the Aspetar Orthopaedic and Sports Medicine Hospital track elite players through fixture piles and report that muscle glycogen stores typically rebound within four days after moderate exertion, yet high-intensity games extend that timeline. Teams facing three matches in eight days often see central midfielders cover 8-12 percent fewer high-speed meters by the third outing, according to GPS data compiled by club medical staffs.
How Congested Schedules Alter Match Dynamics
Fixtures cluster most heavily between September and December plus March and May, when league, cup, and continental commitments overlap. One study released by the European Club Association examined 12 top-division sides across two seasons and found that teams with at least four days between games maintained higher expected goal values in the second half compared with sides on shorter turnarounds.
June 2026 will bring another layer of pressure as nations prepare for the expanded World Cup in the United States, Canada, and Mexico. Clubs releasing players for pre-tournament camps face compressed preparation windows, and historical data from the 2022 tournament cycle indicates elevated injury rates in the weeks immediately following such breaks.
Quantifiable Performance Metrics Tied to Rest
Researchers at the University of Queensland’s School of Human Movement and Nutrition Sciences analyzed 1,400 player-match observations and documented that defenders on two days’ recovery concede 0.18 more expected goals per 90 minutes than those with four or more days. The same dataset revealed forwards convert shots at a 4.2 percent lower rate after abbreviated rest, a trend visible across both major and secondary European leagues.
These shifts influence betting markets that reward total goals, clean sheets, and player-specific props. Accumulator builders who cross-reference fixture density with historical recovery data can isolate sides likely to underperform their season averages in specific statistical categories.
Constructing Accumulators with Recovery Context
Effective strategies start with mapping each team’s upcoming schedule against published rest intervals. Sources such as the UEFA medical reports provide aggregated workload figures that clubs themselves reference during fixture planning. When a side plays midweek in Europe and travels domestically three days later, historical results show a measurable decline in set-piece conversion and an increase in cards conceded.
Another layer involves monitoring substitution patterns. Clubs that rotate heavily after short recovery periods often field lineups missing two or more starters, and betting exchanges adjust totals markets accordingly. Data from the Australian Institute of Sport highlights that teams rotating three or more players after 72-hour turnarounds maintain closer to baseline xG numbers than those relying on the same XI.
Accumulator construction therefore benefits from sequencing selections that pair well-rested sides against fatigued opponents. Markets on both team totals and Asian handicaps respond to these mismatches because the underlying performance data supports the directional movement.
Case Examples from Recent Seasons
During the 2024-25 Premier League winter schedule, one mid-table club played four matches across 12 days and posted its lowest pass-completion percentage of the campaign in the final fixture. The same pattern repeated for several Bundesliga sides navigating Champions League and league doubles. Those results fed directly into accumulator selections that targeted under totals and opponent clean-sheet bonuses.
Similar trends surfaced in the 2025 Copa Libertadores group phase, where South American clubs balancing domestic and continental duties showed elevated foul counts after abbreviated rest. Observers tracking these metrics adjusted their multi-leg bets toward cards and corners markets rather than goal totals alone.
Conclusion
Recovery intervals supply a measurable framework for evaluating team output across congested periods. By aligning fixture lists with established physiological recovery timelines and documented performance decrements, accumulator strategies gain an evidence-based foundation. As calendars grow denser heading into 2026, systematic review of rest data continues to inform selections across multiple markets and competitions.