Navigating the Miles: Travel Fatigue Effects Across Domestic Soccer Leagues and Resulting Betting Market Shifts
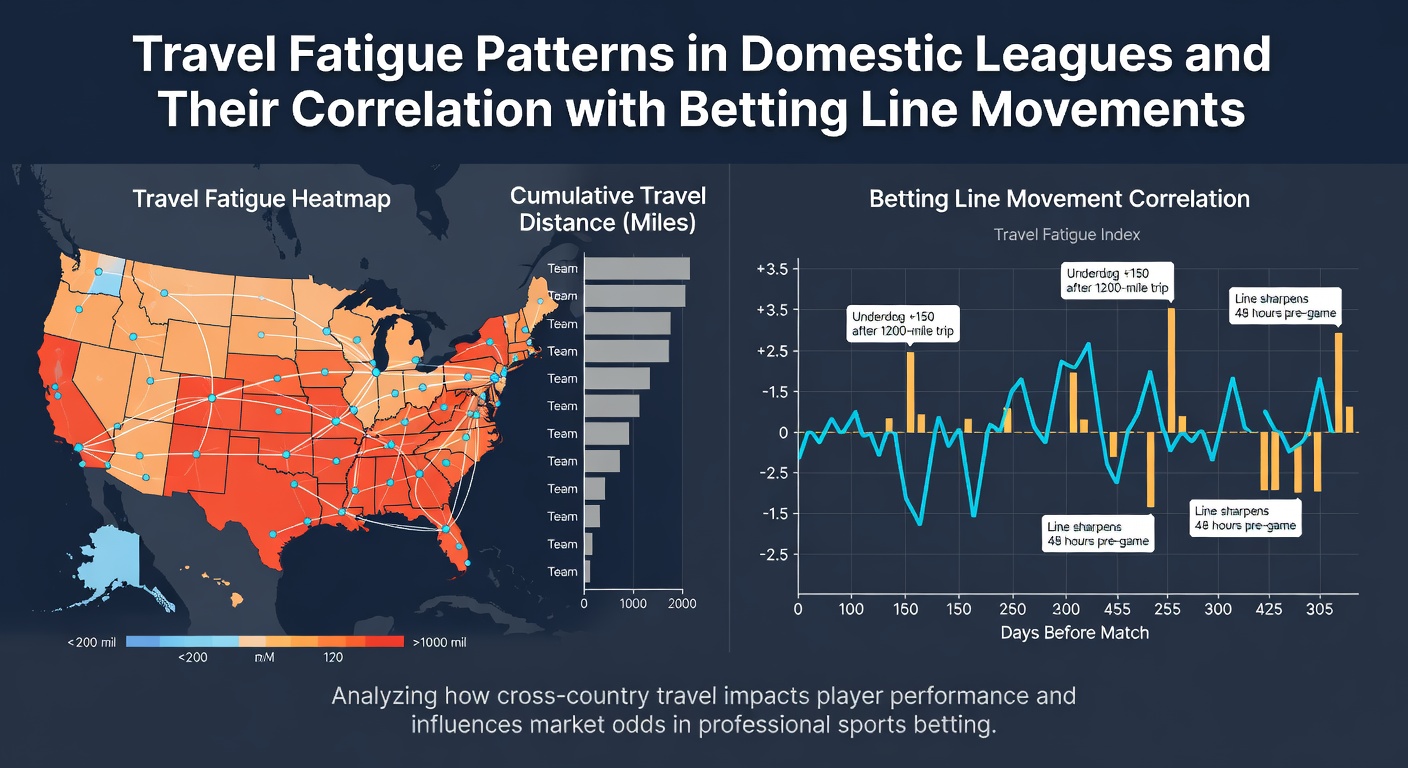
Domestic soccer leagues present unique challenges when teams cross significant distances for matches, and observers have documented consistent patterns where extended travel correlates with measurable drops in performance metrics. Data from multiple seasons shows that clubs covering over 300 miles round-trip in a single midweek window experience average reductions in high-intensity running distance of 8 to 12 percent compared to home fixtures. These shifts appear most pronounced in leagues with wide geographic spreads such as Major League Soccer and the Bundesliga, where east-west or north-south routes introduce time zone changes and recovery limitations.
Geographic Spread and Fixture Scheduling
League calendars place varying demands on squads, and researchers tracking fixture lists note that consecutive away games spanning multiple time zones produce the clearest fatigue signals. In MLS, for example, teams flying from the Pacific to Eastern time zones record elevated rates of late-match substitutions for defensive players, with substitution patterns increasing by roughly 15 percent in the final 20 minutes. European domestic competitions exhibit similar trends when clubs travel across the continent for league matches rather than European fixtures, although the shorter average distances in some nations moderate the effect. Scheduling authorities have adjusted some kickoff times in response to these observations, yet the underlying travel burden remains embedded in the fixture calendar.
Performance Metrics and Recovery Data
Studies compiled by sports science groups indicate that sleep disruption from overnight travel directly influences key performance indicators such as pass completion in the final third and duel win rates. GPS tracking data collected across several leagues reveals that players log fewer explosive efforts in the second half following long-haul journeys, with the decline reaching statistical significance after 400 miles of combined travel within 72 hours. Recovery protocols including compression therapy and adjusted training loads have been adopted by many clubs, yet the cumulative impact across a congested schedule continues to surface in post-match analyses.
Betting Market Adjustments and Line Movements
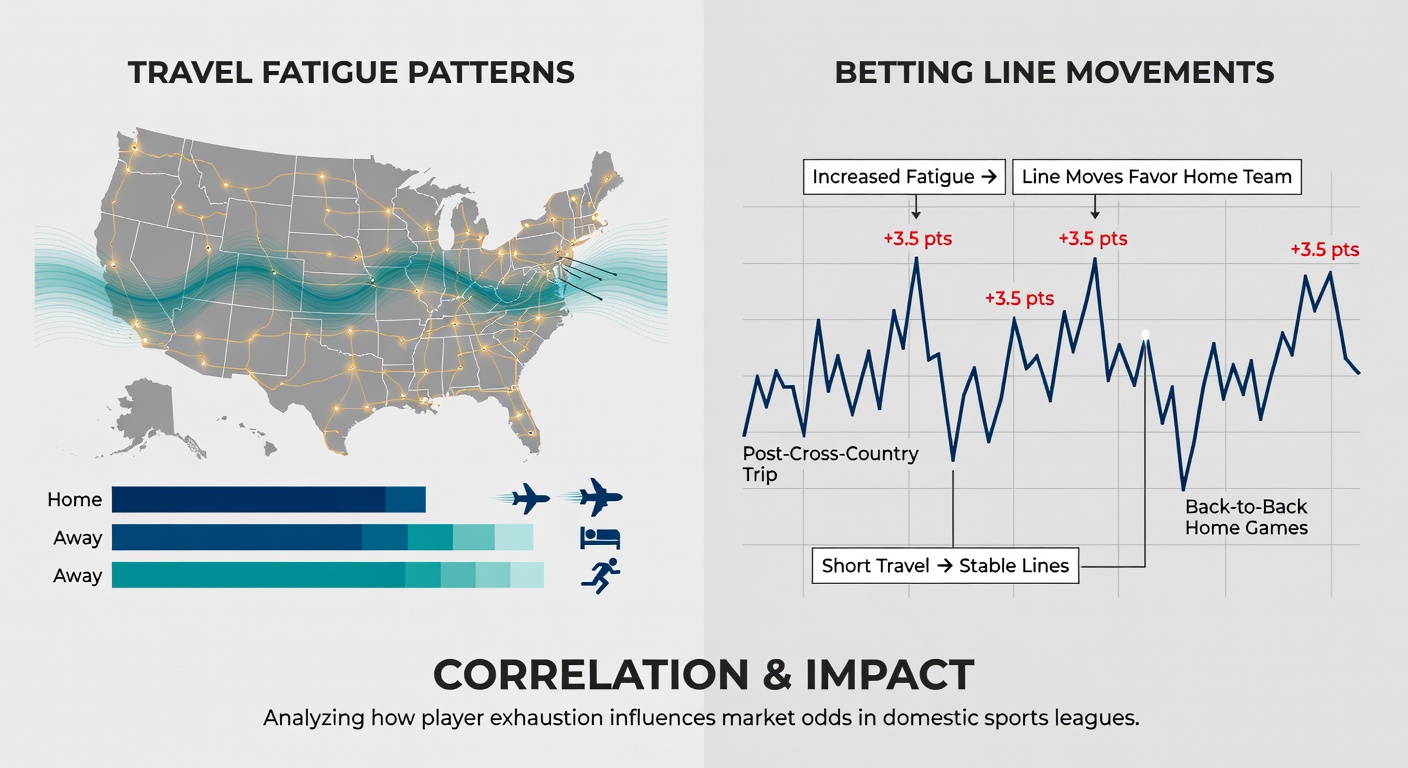
Betting operators monitor these performance patterns closely, and line movements frequently reflect anticipated fatigue effects before kickoff. Historical odds data shows that away teams traveling more than 250 miles open with totals lines lowered by an average of 0.25 goals in the first 48 hours after the fixture announcement. Moneyline adjustments follow a comparable trajectory, with the visiting side drifting by 8 to 15 basis points in markets that update continuously. Sharp bettors who focus on these distance thresholds have documented consistent edges when markets initially undervalue the travel component, although bookmakers have narrowed the gap in recent seasons by incorporating proprietary travel models.
Live betting markets display even more pronounced reactions once matches begin, particularly when early indicators such as reduced sprint counts appear on broadcast analytics. Traders have reported that totals lines compress further during the first half in games involving high-travel away sides, with movement accelerating after the 30-minute mark if possession statistics confirm the expected fatigue profile.
League-Specific Patterns and Case Examples
Each domestic competition produces its own signature travel effects. In the English Championship, shorter average distances limit the overall impact, yet clubs traveling to northern venues from southern bases still exhibit measurable second-half drops in expected goals. Bundesliga sides crossing the country east to west encounter time zone challenges that parallel those seen in North American leagues, and betting lines have reflected these realities through adjusted goal totals in winter months when weather compounds recovery demands. Australian A-League fixtures spanning the continent demonstrate the strongest correlation between distance and line movement, with operators routinely shading totals downward for the longer-travel side within hours of schedule release.
June 2026 schedules introduce additional variables as leagues prepare for the FIFA World Cup break, with several competitions compressing fixtures into shorter windows that amplify existing travel loads. Early season planning documents indicate clubs will face tighter turnaround times between domestic matches immediately before and after the international window, prompting analysts to flag potential spikes in fatigue-related line movements during that period.
Data Integration in Modern Wagering
Advanced modeling now incorporates travel distance alongside traditional factors such as rest days and opponent strength, and platforms that publish these composite metrics show tighter correlations with actual line movements. Academic papers examining multi-season datasets confirm that distance traveled ranks among the top five predictors of away-team underperformance in domestic play, behind only current league position and head-to-head history. Industry reports from sports analytics firms further demonstrate that markets incorporating real-time GPS and recovery data adjust faster than those relying solely on historical averages.
Conclusion
Travel fatigue patterns in domestic leagues continue to influence both on-field results and the betting markets that surround them. As leagues expand geographic footprints and fixture calendars remain dense, the relationship between miles traveled and line movement is expected to stay relevant for data-driven observers tracking performance and odds simultaneously.