Inside Fixture Overload: How Squad Depth Data Shapes Midweek Goal Markets
Fixture congestion hits European football hardest during midweek rounds when domestic leagues collide with Champions League and Europa League schedules, and analysts track how squad depth metrics alter goal outputs in those windows. Data from multiple seasons shows teams with deeper benches maintain higher shot volumes and expected goals totals even after 48-hour turnarounds, whereas thinner squads post measurable drops in attacking metrics that directly feed into over/under markets.
Tracking Rotation Patterns Across Competitions
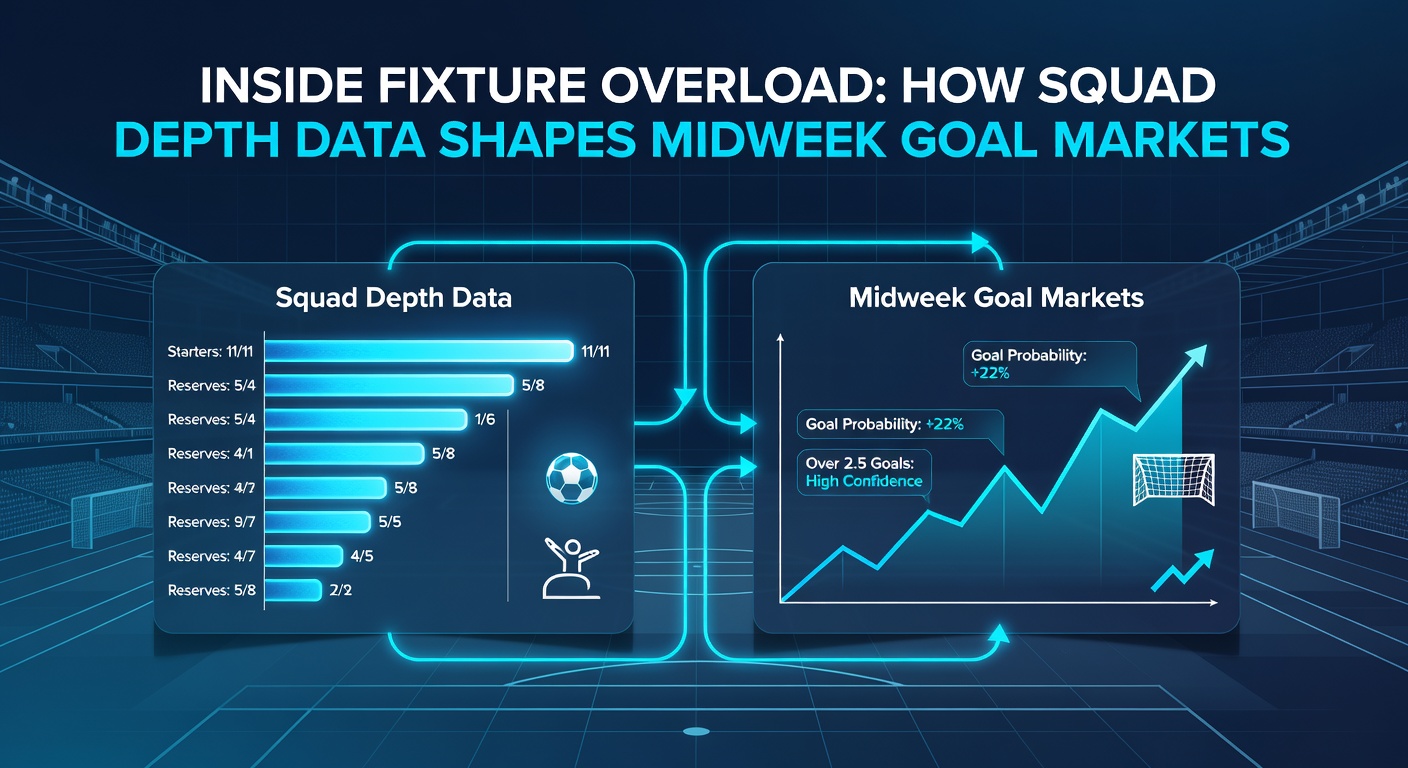
Coaches rotate personnel most aggressively in the weeks that pack three matches into eight days, and researchers at sports analytics departments record average changes in starting elevens that range from five to eight players. Those shifts concentrate in midfield and wide areas where recovery demands peak, while central defenders often stay fixed unless injury forces a change. The result appears in second-half goal tallies because fresher legs preserve pressing intensity and transition speed that create late chances.
Measuring Squad Depth Through Performance Indicators
Clubs publish squad lists that reveal the gap between first-choice starters and the next tier, yet quantitative studies convert those lists into usable depth scores by weighting minutes played, distance covered per 90 minutes, and duel success rates. One project tracking five major leagues found that sides ranked in the top quartile for depth maintained expected goals per 90 minutes within 0.15 of their season average during congested blocks, while bottom-quartile sides fell by 0.35 or more. The same dataset links higher depth scores to elevated corner counts and shots from outside the box, both of which correlate with total goals crossing market thresholds.
Goal Market Reactions in Midweek Windows
Betting exchanges adjust totals lines within minutes of lineup announcements, and historical price movements show over 2.5 goals lines shorten when two deep squads meet while lengthening when either side displays multiple rotation markers. In June 2026 the expanded Club World Cup calendar will add another layer of fixture pressure for participating teams, and early modeling already indicates goal markets will widen further because recovery periods shrink below 72 hours for several clubs. Observers note that wide forwards and attacking midfielders suffer the steepest performance decay under short rest, which reduces creative output and therefore total goals when those positions rely on substitutes.

Case Examples From Recent Seasons
Take one Premier League side that rotated six players ahead of a Thursday Europa League tie followed by a Sunday league match. Their shots on target dropped 22 percent in the second leg of the double, and the totals market settled under the posted line. A contrasting Bundesliga example shows a squad that retained four of its top six attackers through both legs and posted 18 shots in the return fixture, pushing the goal line over. Patterns repeat across the continent because the underlying physiological data on muscle recovery and sprint volume remains consistent regardless of league.
External Data Sources and Modeling Approaches
Academic groups combine GPS workload figures with match-event data to forecast goal probabilities under fatigue, and several federations now release anonymized squad reports that feed these models. A joint study released through the FIFA Technical Department examined 1,200 midweek fixtures and confirmed that depth advantages translate into a 12 percent increase in expected goals when both teams operate on two days rest. Industry analysts incorporate those findings into real-time dashboards that update market probabilities as lineups drop.
Another report compiled by the European Club Association highlights how travel distance compounds the rotation challenge, with clubs logging over 1,200 kilometers between matches showing steeper declines in high-intensity runs. Those runs directly precede chance creation, so goal markets price the effect accordingly once fixture lists and travel schedules become public.
Conclusion
Squad depth data supplies a measurable edge in midweek goal markets because rotation decisions alter shot creation and defensive structure in predictable ways. As calendars grow denser through 2026 and beyond, the same metrics will continue to shape pricing and outcomes across domestic and continental competitions.