Charting Seasonal Trends in Goal Line Markets Across Major European Football Divisions
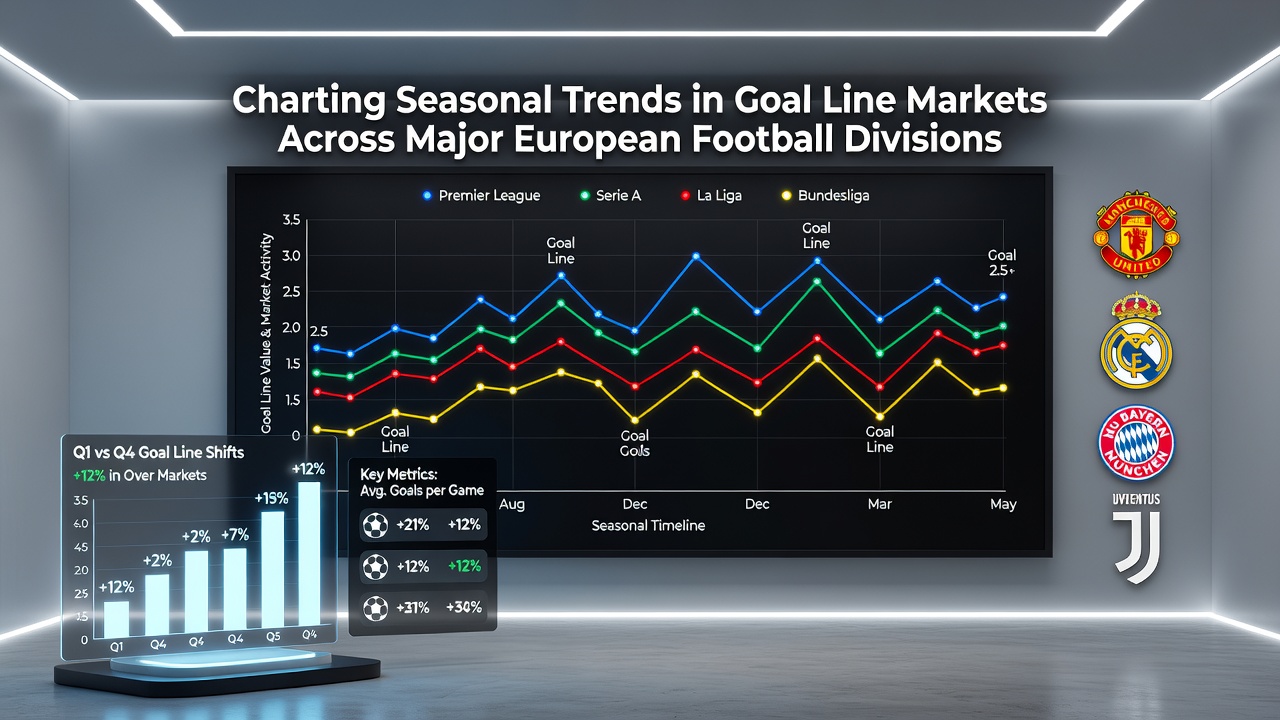
Goal line markets focus on total goals scored in matches and analysts track how averages shift across different phases of the campaign in leagues such as the Premier League, La Liga, Bundesliga, Serie A and Ligue 1. Data compiled over multiple seasons shows consistent variations tied to weather patterns, fixture density and squad rotation policies that teams adopt at specific points in the year.
Early Season Patterns in August and September
Campaigns typically open in August and researchers note elevated goal tallies during the first six to eight weeks because squads experiment with new signings while defensive structures remain unsettled. Bundesliga matches in this window often exceed 3.1 goals per game on average according to official league records, whereas Serie A fixtures hover closer to 2.6. The contrast arises from contrasting tactical approaches that teams employ when fresh legs dominate lineups.
Mid-Season Adjustments and Fixture Congestion
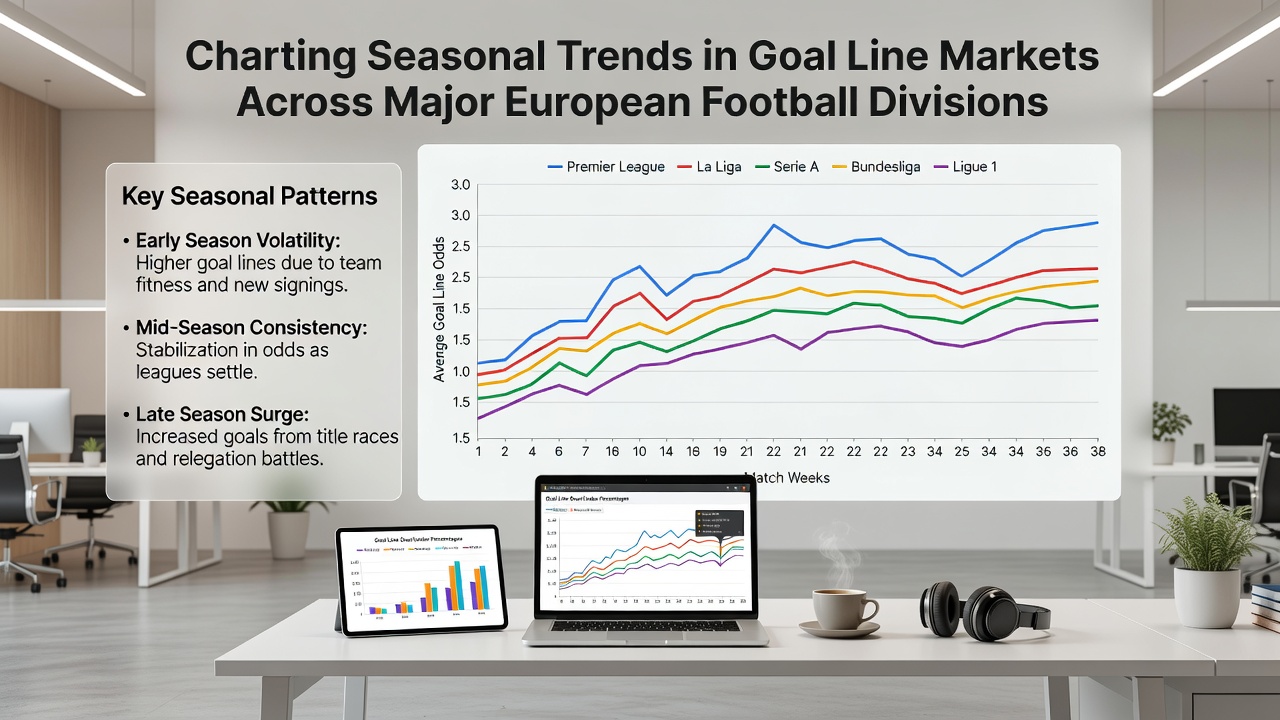
By November and December congestion intensifies and observers record dips in goal output across several divisions. Teams that participate in European competitions rotate personnel more aggressively and this leads to fewer high-scoring encounters in domestic leagues. Figures from the 2024-2025 season illustrate that Ligue 1 recorded its lowest monthly goal average in December at 2.4 per match while the Bundesliga maintained a higher baseline near 3.0. These patterns repeat because physical fatigue and tactical caution increase together.
Winter Intervals and Post-Break Resumption
January brings varied outcomes depending on whether a league observes a winter break. Leagues with a pause such as Bundesliga and Serie A see goal rates climb again once play resumes because players return rested and attacking drills receive renewed emphasis in training. In contrast divisions without a formal break experience continued low-scoring trends until February when weather improves and pitches recover. A comparative analysis released by sports analytics group Opta highlights that Bundesliga goal averages rise by 0.4 per game in the first post-break month.
Late Season Dynamics and Motivation Factors
April and May introduce motivation-driven swings where teams fighting relegation or chasing titles adjust styles dramatically. Data indicates that matches involving mid-table sides produce fewer goals as both teams adopt risk-averse setups whereas games between title contenders and lower-ranked opponents often feature more open play. La Liga records from recent campaigns demonstrate that goal averages climb above 2.9 in fixtures where one side has nothing left to play for while the opponent still competes for European spots.
Weather Influence Across Regions
Northern and southern European leagues diverge in how precipitation and temperature affect play. Wet conditions in England and Germany correlate with higher goal counts because slippery surfaces disrupt defensive timing whereas drier climates in Spain and Italy allow tighter marking and lower scoring. Meteorological data cross-referenced with match statistics shows a measurable uptick in over 2.5 goal outcomes during periods of heavy rain in the Premier League.
Comparative League Profiles
Each major division maintains a distinct seasonal signature. Bundesliga maintains the highest overall average near 3.2 goals per match yet shows the sharpest early-season spike. Serie A starts conservatively and climbs gradually after the winter pause. Premier League figures remain stable year-round with minor dips during holiday periods. These profiles emerge from long-term aggregation of official match reports and allow bettors to align goal line selections with historical monthly norms.
August 2026 Outlook
As new campaigns prepare to launch in August 2026 pre-season fitness reports and transfer activity suggest similar early trends will appear. Analysts anticipate Bundesliga matches will again post elevated goal numbers while defensive-minded sides in Italy and Spain begin with lower outputs. Tracking these opening weeks provides baseline data for the remainder of the season.
Conclusion
Seasonal charting of goal line markets reveals repeatable cycles driven by weather, scheduling and squad management across Europe's leading divisions. Consistent data collection from league authorities and performance databases enables precise mapping of when averages rise or fall. Those who monitor these patterns gain structured insight into how total goals distribute throughout the year.